 TradingAlpha
 Identify the signal
A turquoise R is a potential bullish reversal. A yellow R is a potential bearish reversal. These signals identify possible changes in direction; the signal candle alone is not price-action confirmation.
Price-action confirmation
The indicator guide's method looks at the next two candles:
| Signal | Price-action confirmation |
|---|---|
| Bullish reversal | One of the next two candles closes above the reversal candle's high wick |
| Bearish reversal | One of the next two candles closes below the reversal candle's low wick |
A wick crossing the level during a forming candle is not the required close. If neither of those next two candles closes beyond the level, do not retrospectively call a much later move this two-candle confirmation.
Work through an example
Suppose a bullish reversal candle has a high of 100. The next candle trades at 102 but closes at 99: no confirmation yet. If the second candle closes at 101, the price-action condition is satisfied. This example illustrates the rule, not a trade recommendation.
Historical chart example
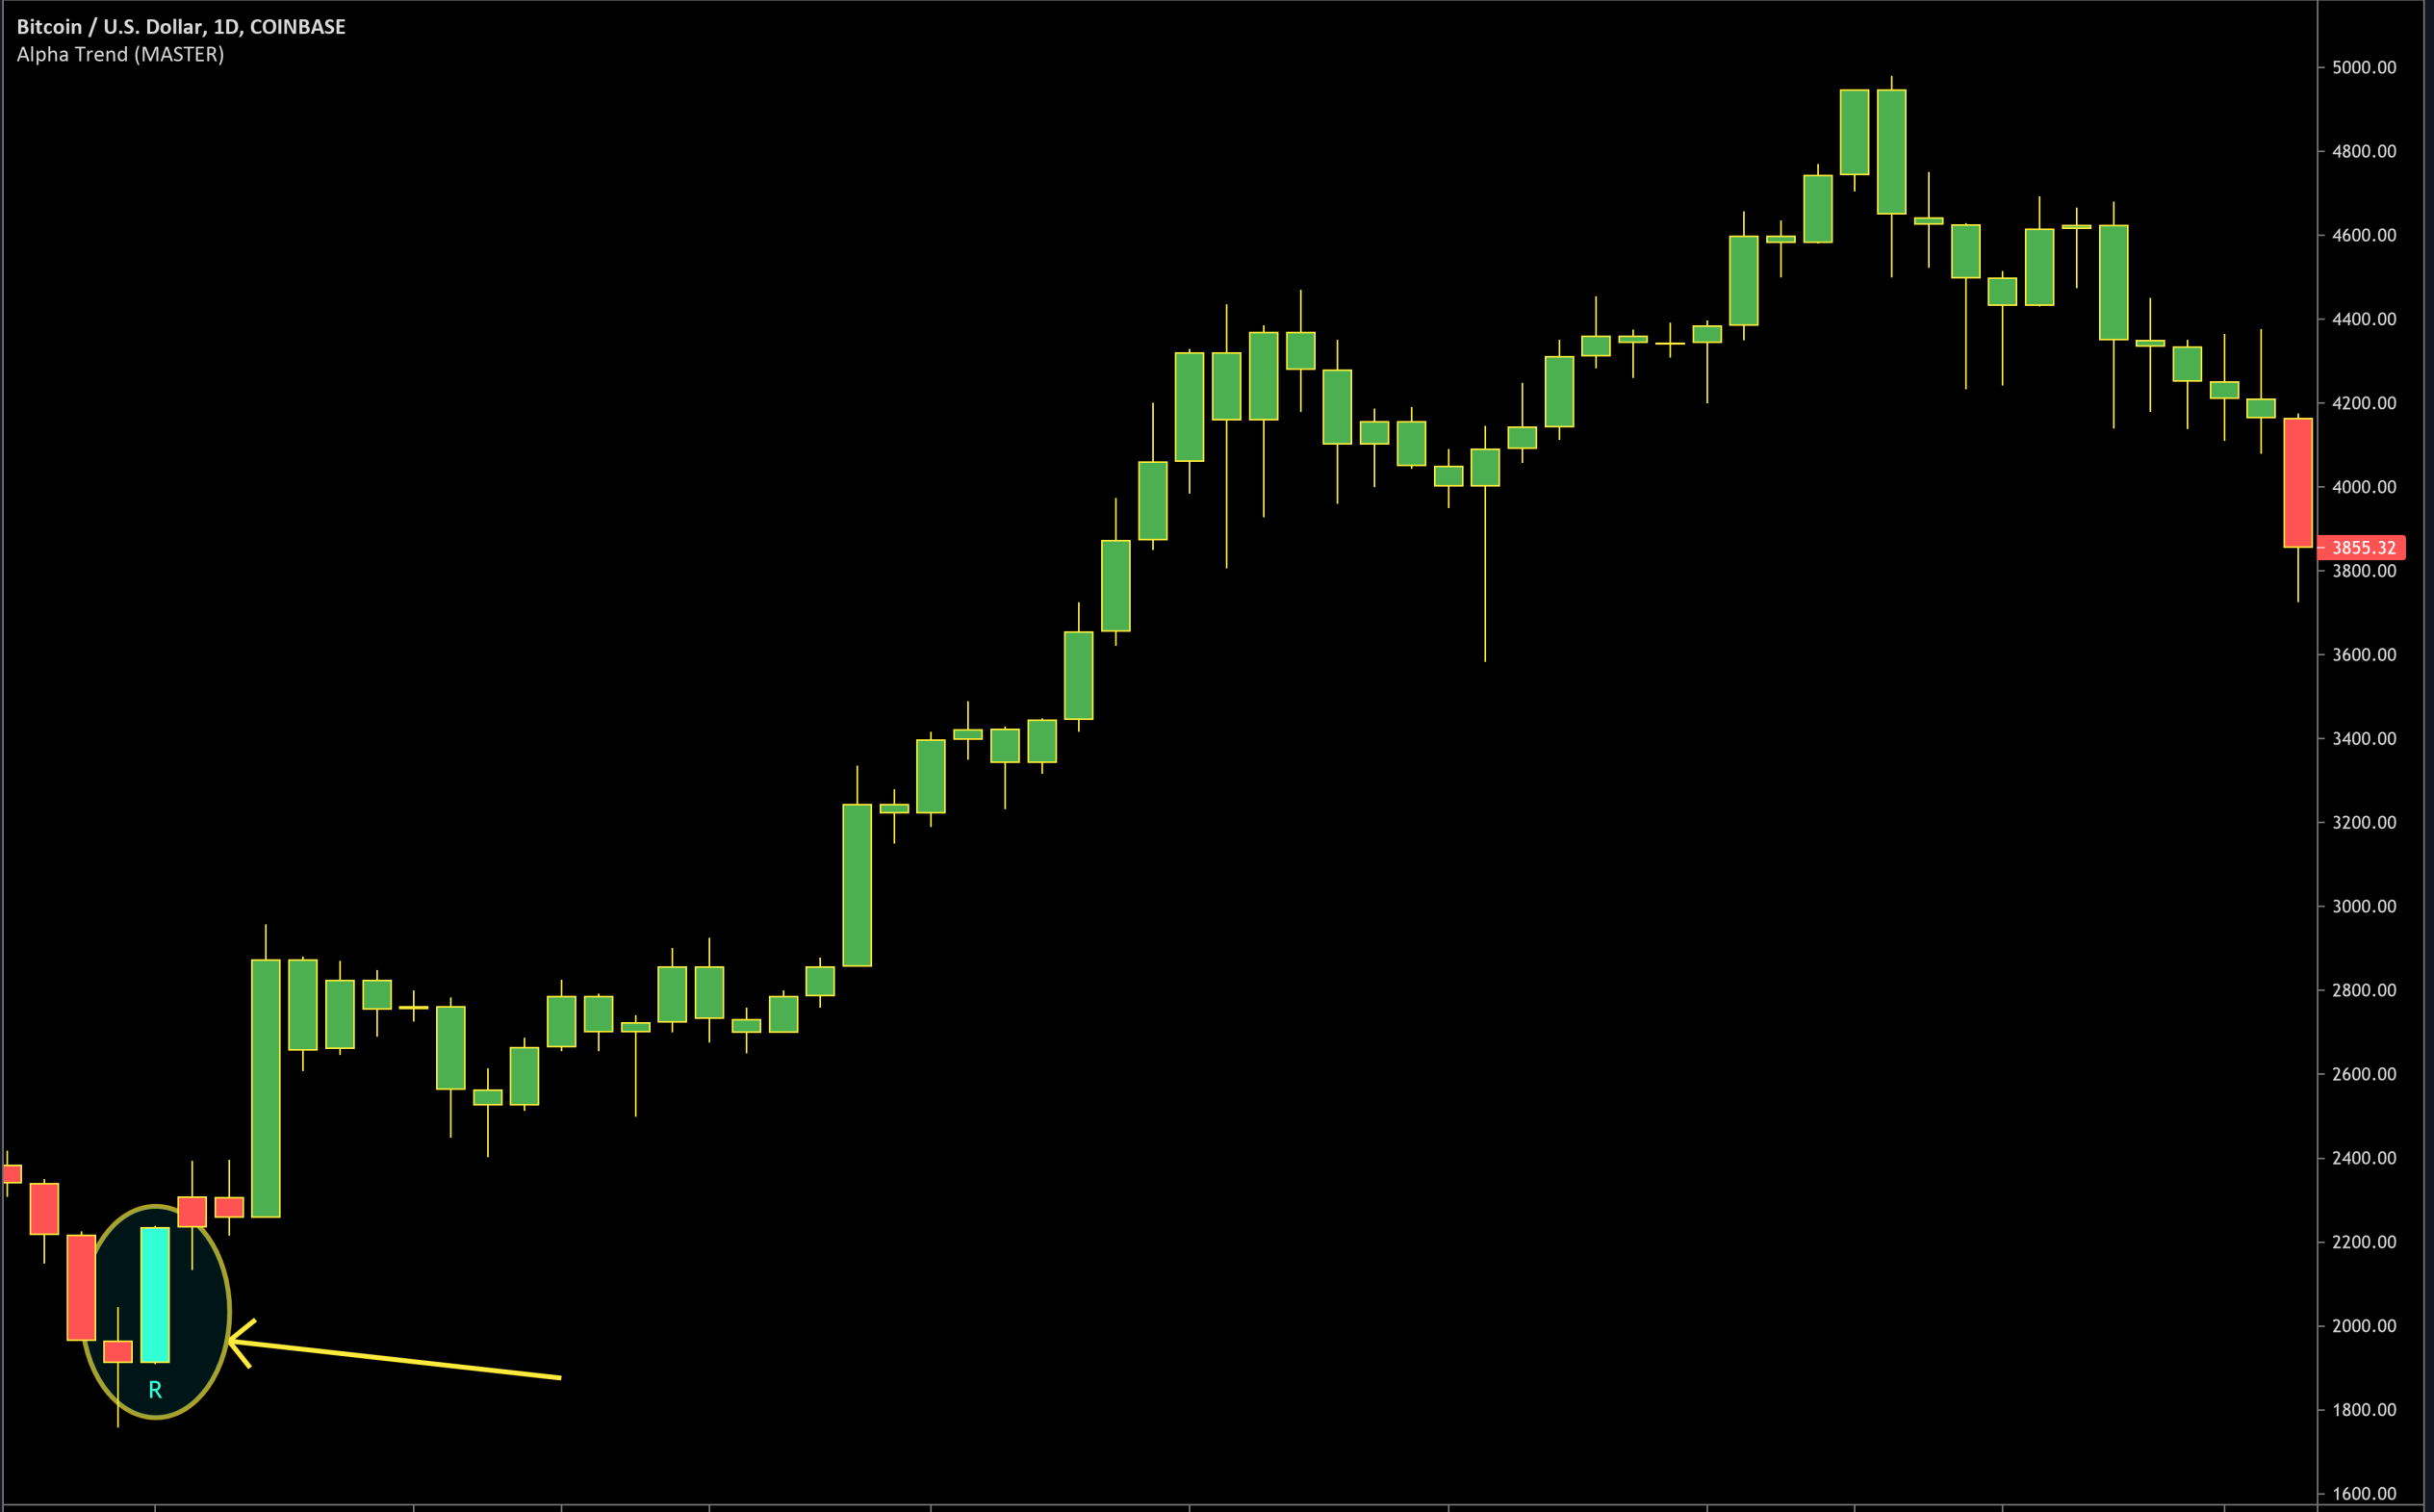
Historical example retained from the original TradingAlpha guide. The circled R identifies the setup candle; inspect the following candle closes to evaluate confirmation. This is not a current UI screenshot or a performance claim.
Other confirmation tools
RSI and Thrust can add momentum context. The older guide also uses them as alternative confluence methods. Keep that analysis separate from the app's explicitly named confirmed-reversal filter; additional context does not automatically change a stored scan condition.
What to check next
Inspect the broader trend, nearby support/resistance, and whether the signal follows a squeeze breakout. A reversal against a recent squeeze breakout can be part of a squeeze fakeout. Define the point at which your interpretation would fail.