 TradingAlpha
 Read a row
A row describes one instrument on one timeframe. Price and percentage change are market information; signal chips describe indicator conditions. Do not assume a price refresh means the signal calculation also just ran.
Sort by the column that matches your question. A large price move and a strong signal reading are different observations. Green and red styling provides direction; it does not remove the need to read the label.
Customize your view
Use Columns to choose the fields you want to see. Keep the most useful comparisons visible and hide distractions. On smaller screens the app uses a compact presentation; open the row's controls for details that do not fit in the list.
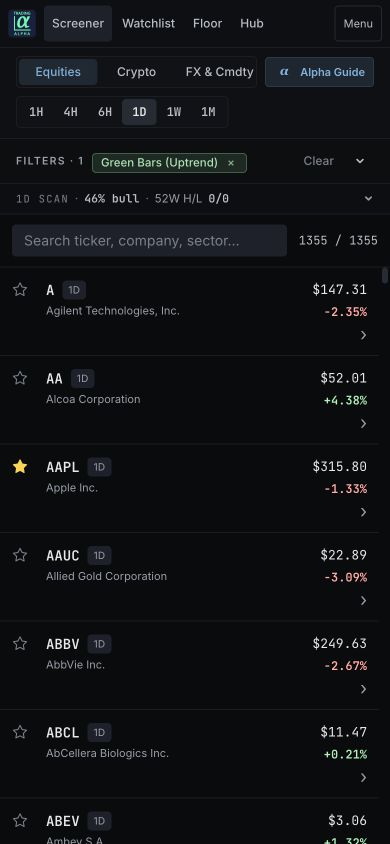
Mobile controls consolidate the same screening workflow into less space.
Open chart context
Use a result's detail control to explore the information available for that asset. Use TradingView when you want your own chart layout and purchased indicators. Opening a ticker does not place an order.
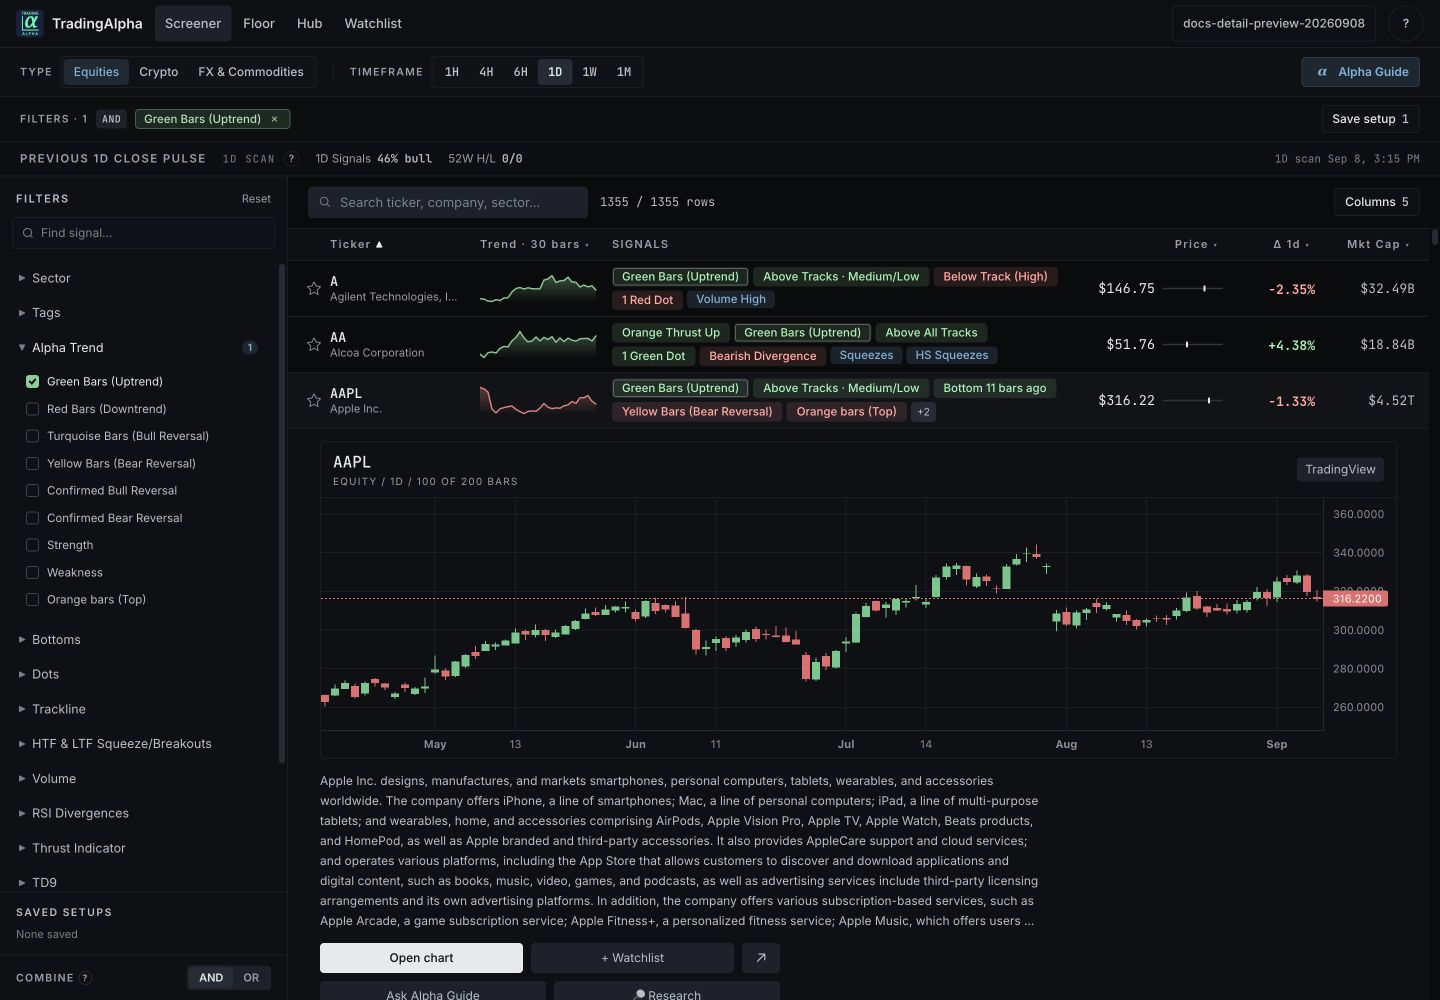
Click the company name or row to expand its details. TradingView opens your external chart; the star and Watchlist controls save the ticker.
Match the timeframe and market feed when comparing readings. A crypto pair quoted in another currency, another exchange, or a developing candle can differ from the scan.
Missing and delayed values
An em dash means a value is unavailable. It is not zero, and it does not mean a company or asset has disappeared. Market data, scan results, and calendars refresh independently. Outside the equity session, the latest price can describe a completed session.
If a chart and row disagree, check the symbol, exchange, timeframe, and timestamps first. Troubleshooting has a short checklist.