 TradingAlpha
 Green and red bars
Green trend bars describe a bullish trend; red trend bars describe a bearish trend. Their purpose is to provide a more persistent context than a single price candle. A red price move inside a green trend does not alone prove the broader trend has reversed.
In the Screener, trend confirmation uses two adjacent completed same-color dots, with neutral dots breaking the confirming pair. The trend remains until an opposite pair confirms. This is a current-trend reading, not a “switched within four bars” filter.
Alpha Dots
Dots show the more responsive micro trend. Green and red dots can help you notice a shift before the broader bars change. They can also supply context around a reversal, top, or bottom setup.
If dots are absent, check the Alpha Trend settings: optional displays may be disabled. Wait for candle completion when evaluating a lasting change.
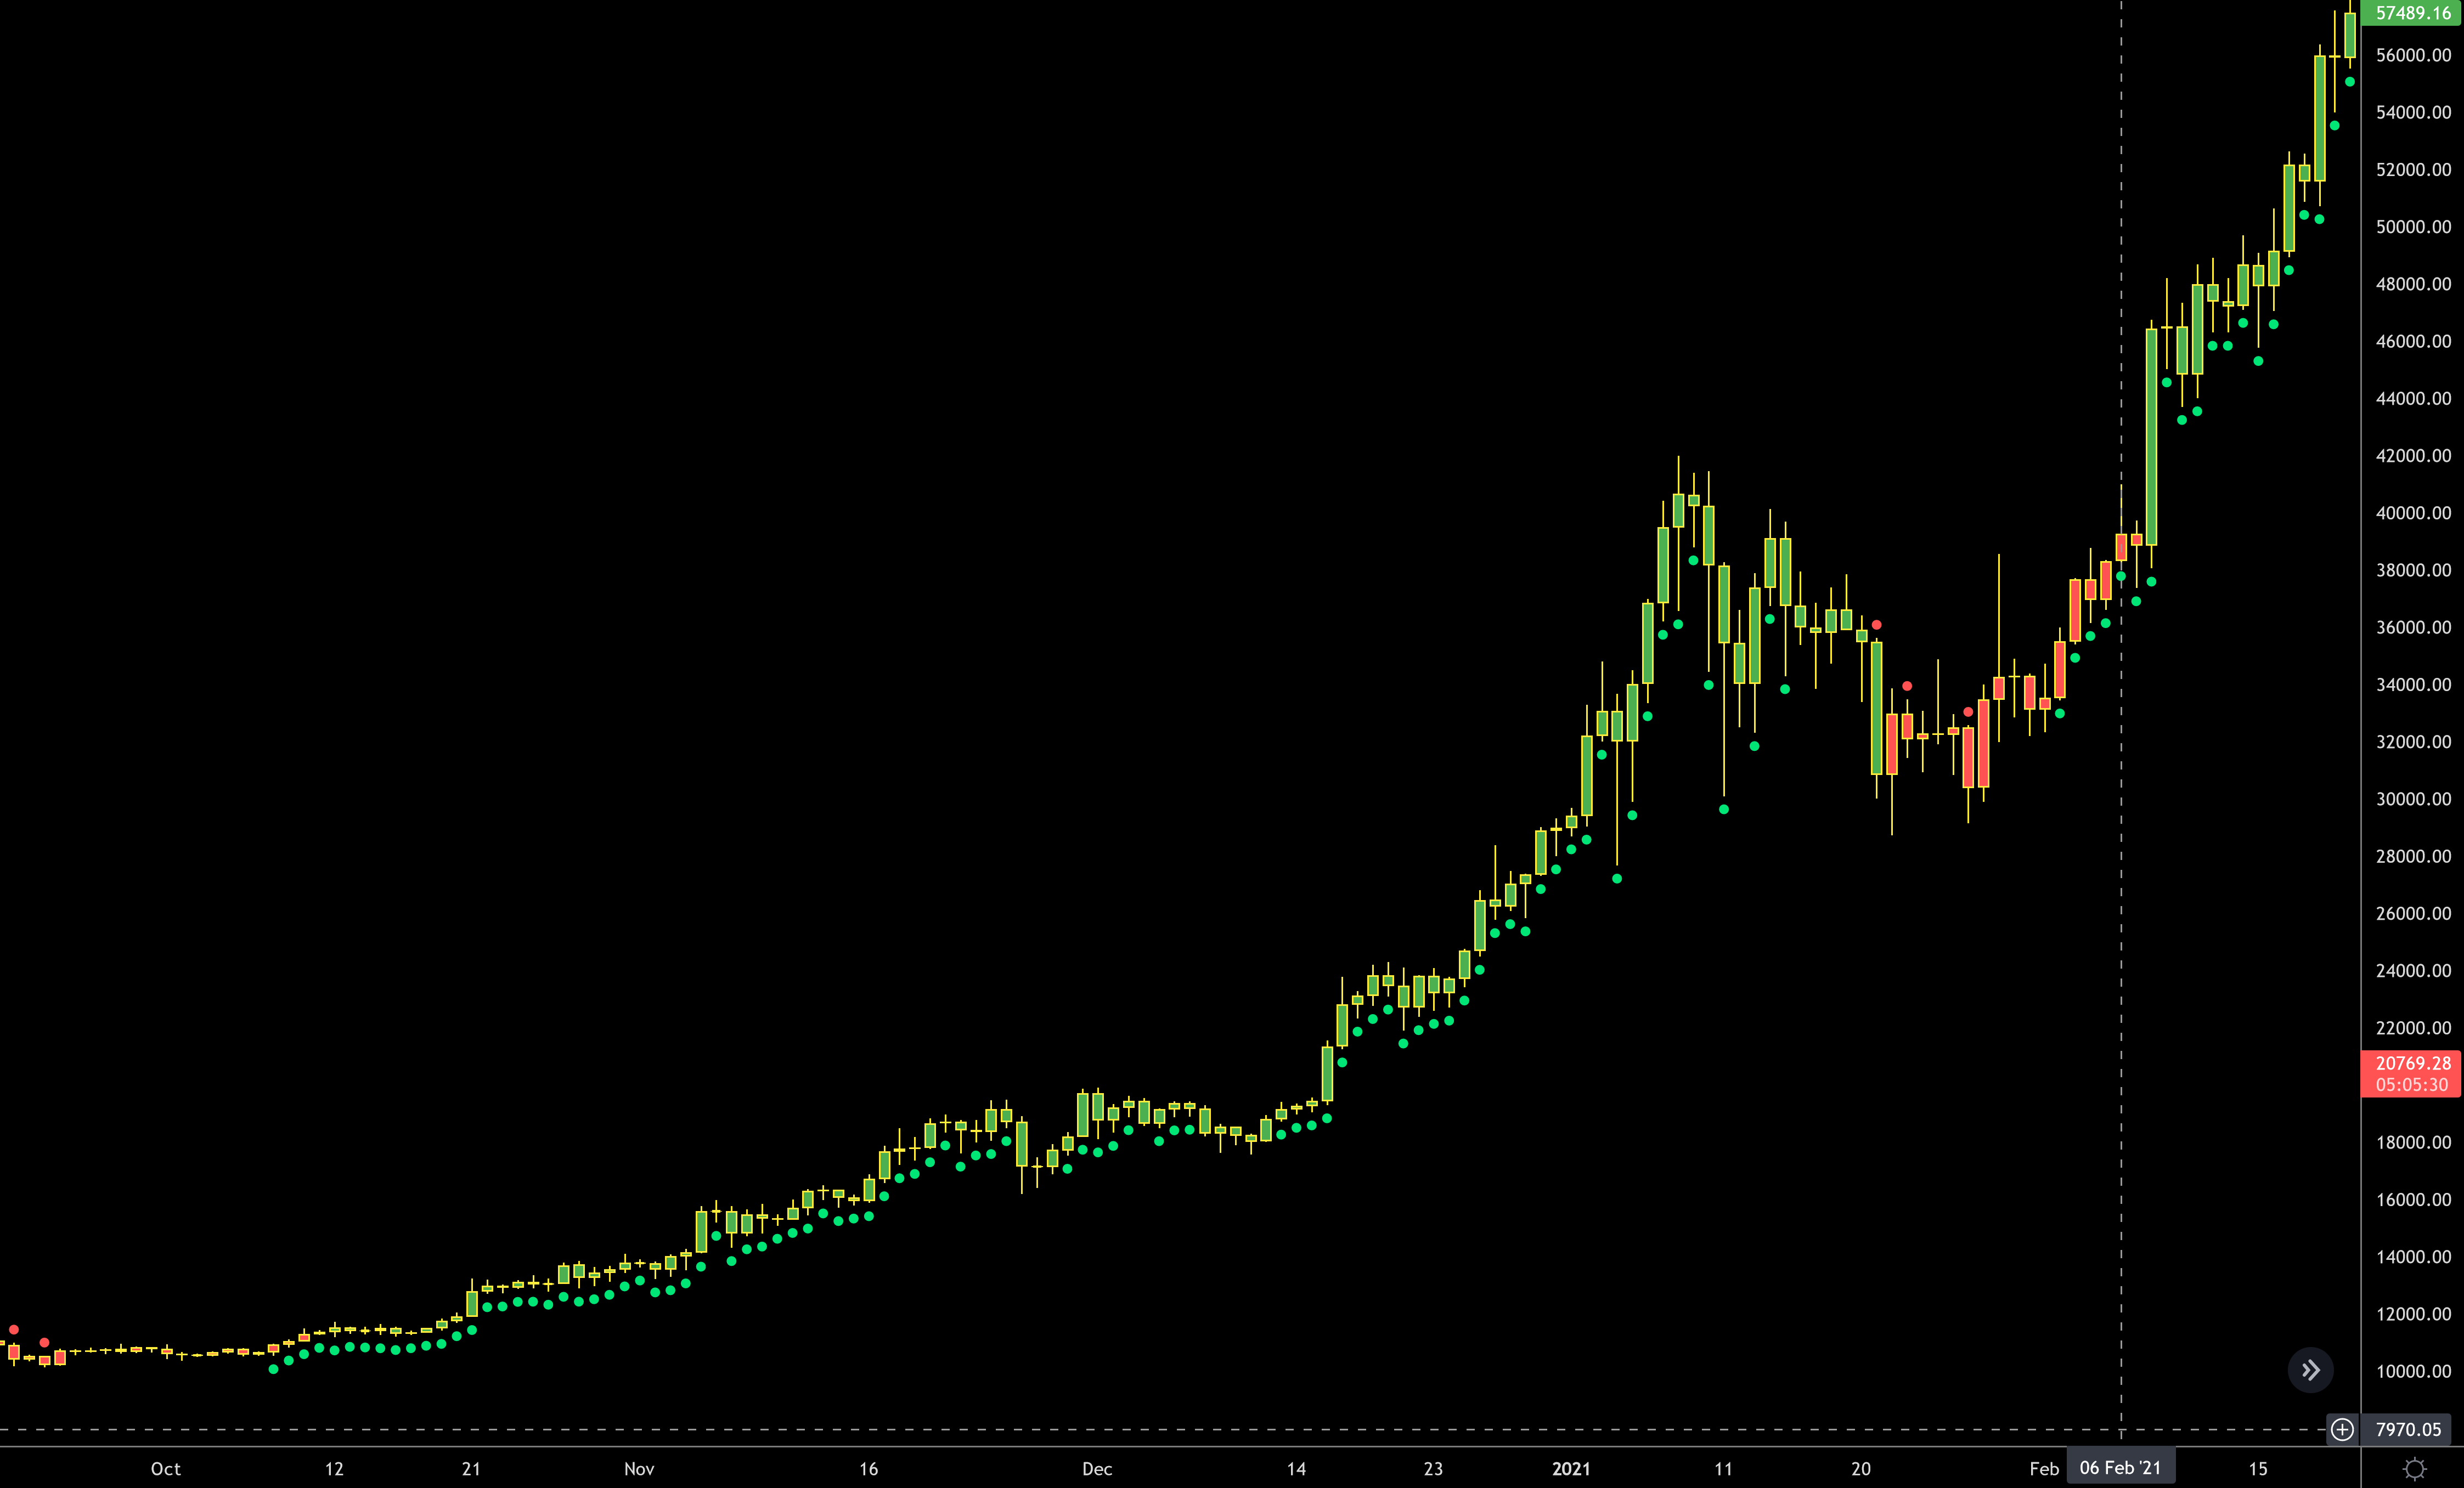
Historical 2020–2021 example retained from the original guide. Dots can change during pullbacks; the example does not establish future performance.
Strength and weakness arrows
Green strength arrows indicate bullish continuation context. Red weakness arrows indicate bearish continuation context. They can help you examine whether a pullback is occurring within a still-supported trend, but they do not promise that continuation will occur.
Do not confuse them with the lighter-colored breakout arrows associated with HTF/LTF squeeze shading.
Alpha Track
Enable Track in the suite's settings if you want its line on the chart. The guide identifies green as bullish, yellow as caution, and red as bearish. Price above Track adds bullish context; price below it adds bearish context. It may act as a moving support/resistance reference, but a touch does not guarantee a bounce.
Track offers Low, Medium, and High intensity settings. Check which setting you are comparing with a Screener Trackline condition. Consecutive green dots above Track, or red dots below it, are examples of combined micro-trend and price-position observations. It is a different tool from Alpha Stops, which is configured around a particular trade.
Review checklist
Check the timeframe, wait for the candle to complete, and compare the dots, broader bars, and surrounding setup. Record what would invalidate your idea instead of relying on color alone.