 TradingAlpha
 Choose the suite
HTF and LTF are the higher- and lower-timeframe volatility suites. Use the installed suite and settings appropriate to the timeframe you are studying. Their squeeze and momentum tools complement Alpha Trend; they do not replace its signal meanings.
Trend and momentum bars
Read the suite's trend and momentum colors in its own context. Because multiple suites can color price candles, check which script controls the visible bar colors. A bullish momentum reading inside a squeeze may add directional context, but the squeeze itself does not guarantee a bullish breakout.
The squeeze sequence
Shaded squeeze areas mark volatility compression. Small breakout arrows identify potential directional expansion; larger arrows represent the suite's confirmed breakout signal. Green arrows are bullish and red arrows bearish.
Wait for the relevant candle to complete. A developing breakout can change before the close. The Screener's regular and higher-sensitivity conditions are different selections; use the label that matches what you intend to scan.
Historical squeeze example
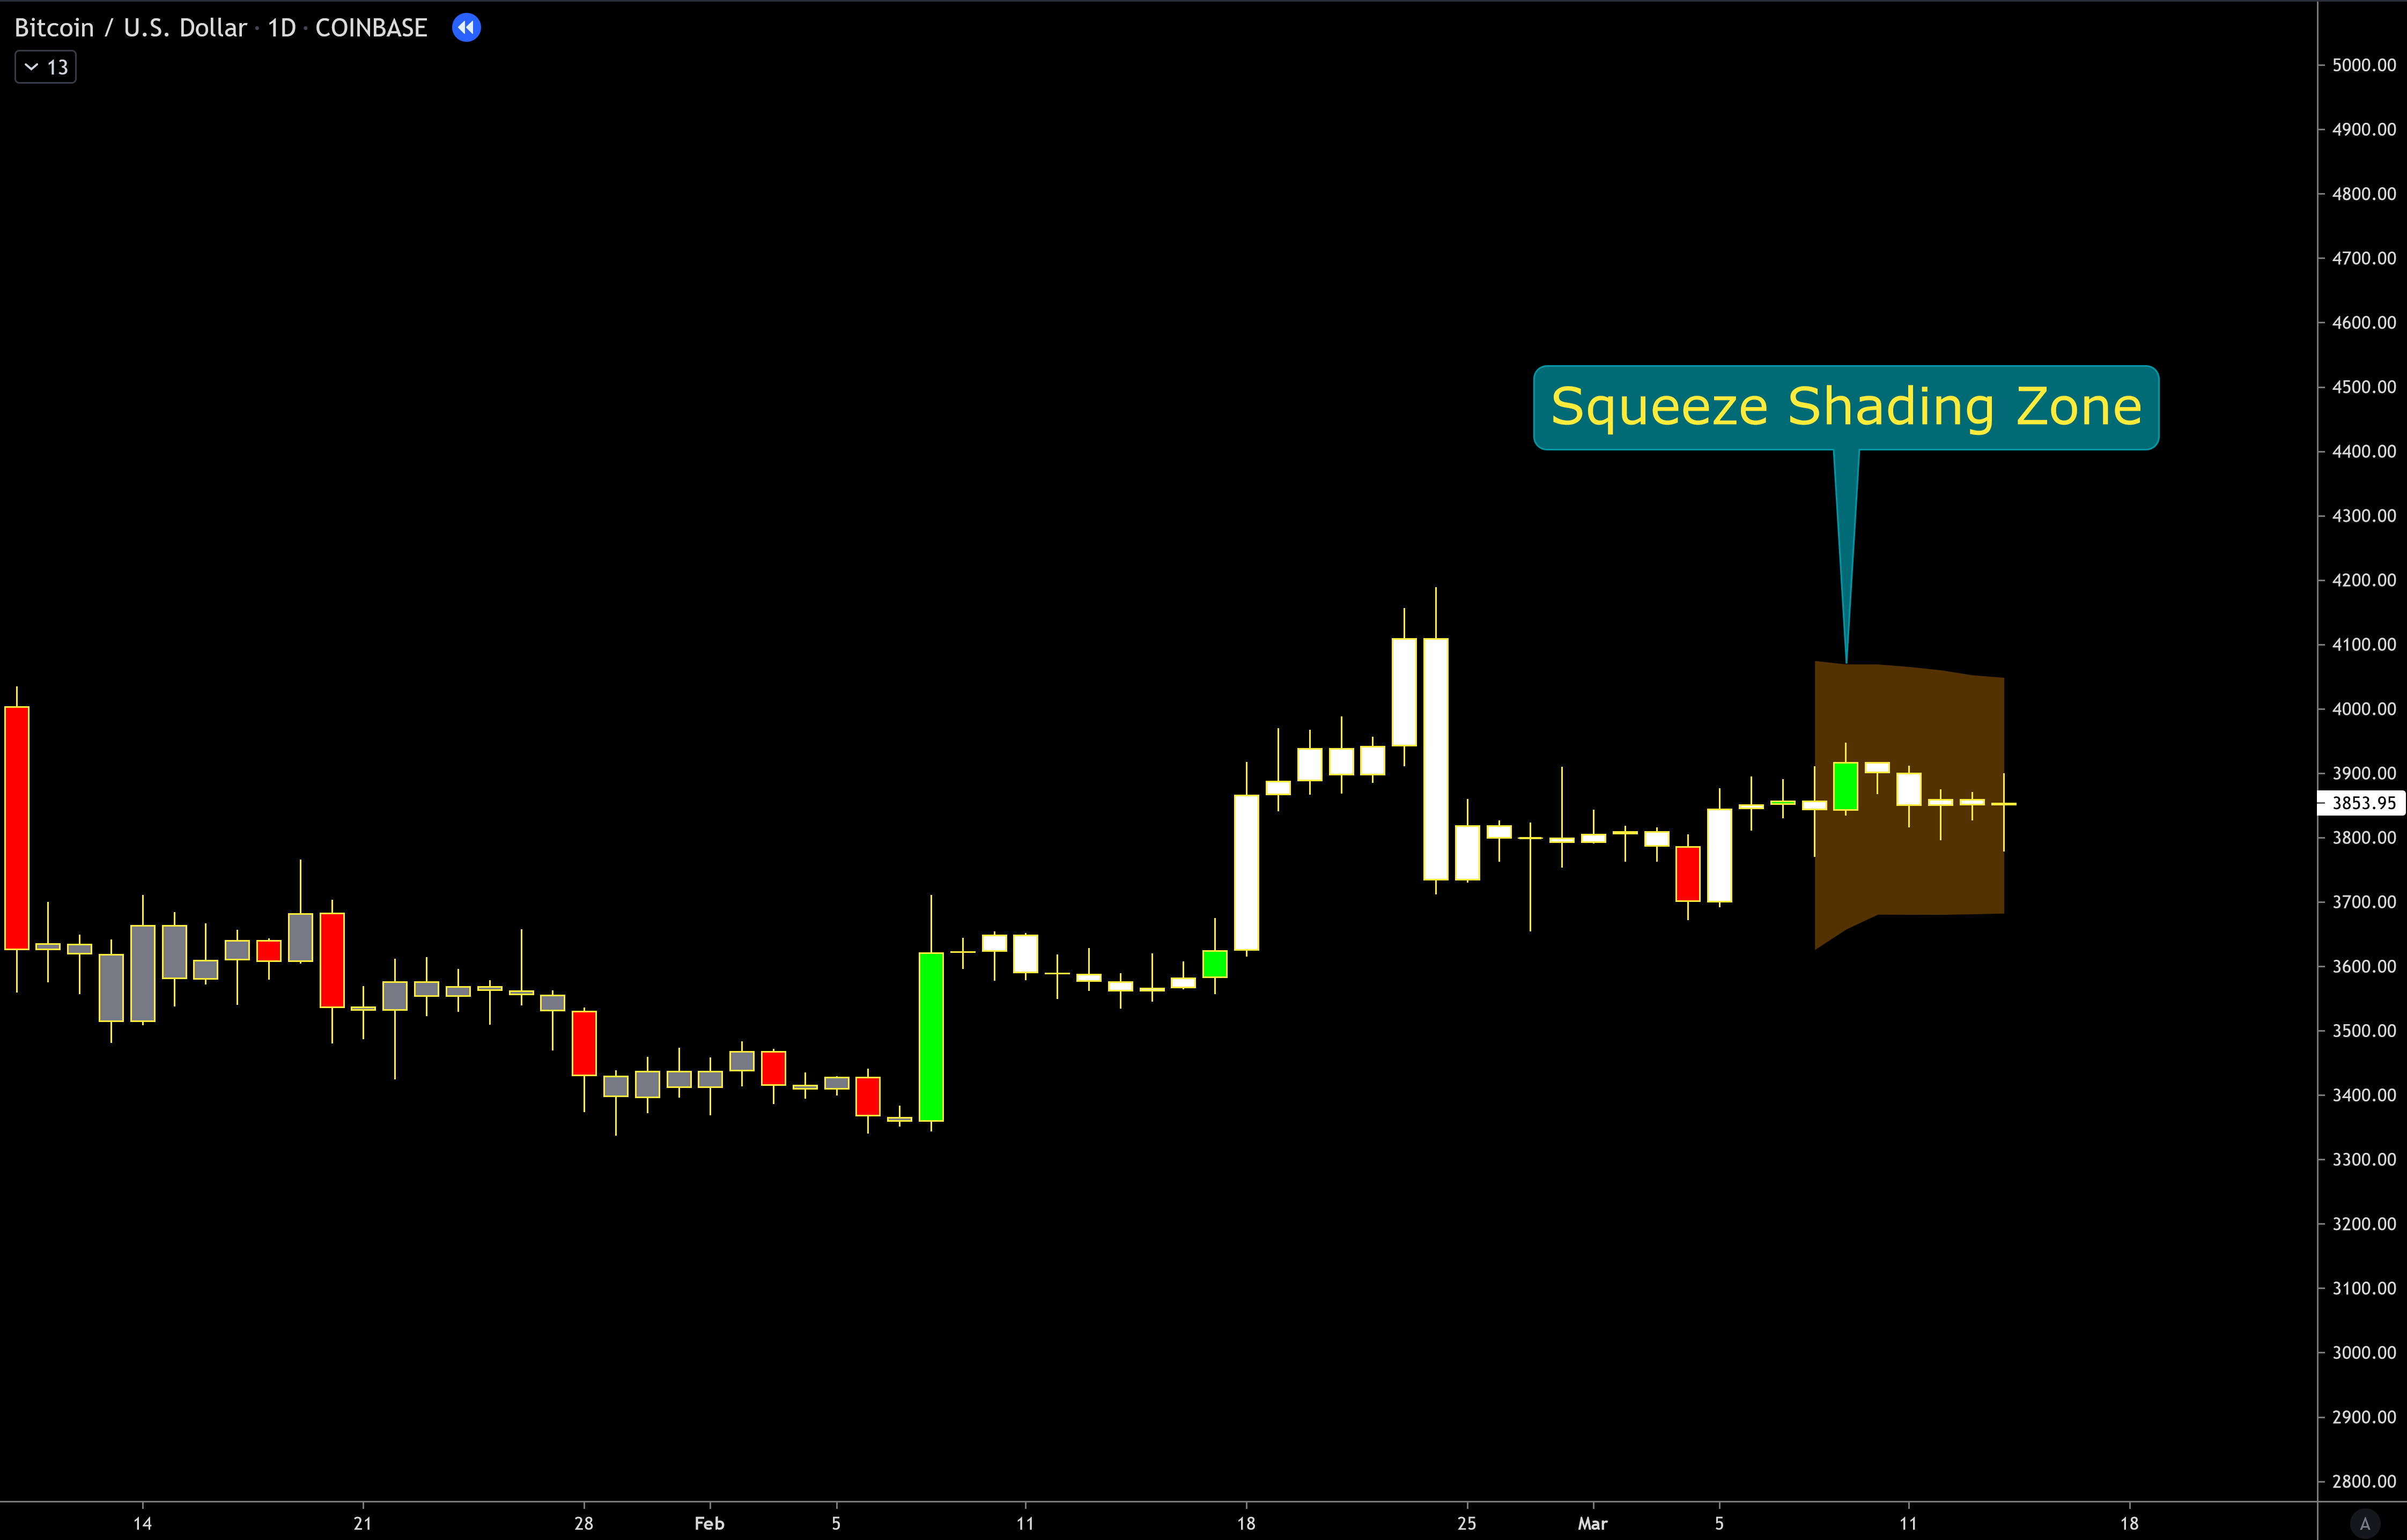
Historical example from the original guide. The shading identifies compression; this image alone does not establish a completed breakout or its direction.
Squeeze fakeouts
A fakeout combines the suites: a squeeze breakout develops, then an Alpha Trend reversal appears against its direction. Apply the reversal's confirmation method rather than treating the opposing R as an automatic completed reversal.
For example, after a bullish breakout, a yellow bearish R is a warning to investigate failure. A subsequent qualifying close below the reversal candle's low confirms that price-action reversal method.
Caution and danger Xs
Yellow caution and red danger Xs highlight weakening or exhausted breakout expansion. They concern the breakout leg, not a guarantee that the entire broader trend is finished. Check your installed suite's options: the legacy guide limits these warnings to the premium HTF suite rather than all LTF versions.
TD 8 and 9
These exhaustion markers highlight stretched directional conditions. Green markers indicate the bullish/oversold side; red markers the bearish/overbought side. A 9 represents a later stage of the count than an 8, not a promise that the next candle reverses.
Use them with trend and confirmation. Do not translate the simplified old description into an assumed “eight consecutive green candles” scan rule.